

Unlock the Power of Data with the Best AI Tools for Business Analytics! Are you ready to revolutionize your business decision-making?
Dive into our curated list of cutting-edge AI tools that will supercharge your data-driven strategies.
From automating insights to predicting trends, these tools empower you to extract maximum value from your data.
Whether you’re a seasoned analyst or a curious business leader, these tools are your secret weapon.
Discover how Julius AI, Tableau, Polymer, MonkeyLearn, and more can transform your business landscape.

Remember, knowledge is your competitive edge. Don’t miss out—explore these AI tools today!
How AI Can Help Business
Artificial Intelligence (AI) is revolutionizing the way businesses operate, offering unprecedented opportunities for growth, efficiency, and customer satisfaction. Here’s how AI can help businesses across various domains:
- Data Analysis and Insights: AI dramatically enhances the capabilities of data analysts by sifting through large datasets to uncover patterns, trends, and anomalies. This not only speeds up the data analysis process but also provides deeper, actionable insights that can drive innovation and competitive advantage.
- Automated Decision-Making: AI analyzes data to provide insights, enabling faster, data-driven decisions. Predictive analytics anticipate trends, guiding strategic planning and risk management.
- Efficiency in Operations: By automating routine tasks, AI boosts productivity and minimizes errors, allowing employees to focus on higher-value activities.
- Enhanced Customer Experience: AI powers chatbots and personalization algorithms to offer round-the-clock customer service and tailored experiences, increasing engagement and loyalty.
- Supply Chain Optimization: AI predicts demand, optimizes inventory, and improves logistics, ensuring efficient operation and reducing costs.
- Advanced Security Measures: AI improves security by quickly identifying and responding to potential threats, protecting businesses from fraud and cyberattacks.
List of Best AI Tools for Business Analytics
1 Julius AI
Julius AI is AI data analyst tool designed to transform the way you analyze and visualize data.
With its computational AI, you can effortlessly chat with your data files, generate charts, and forecasting models, and gain expert-level insights in seconds.
Tailored for simplicity and intuitiveness, it automates data visualization, insights, and advanced analysis, serving over 500,000 users globally.
Ideal for tackling math, physics, and chemistry problems, or creating comprehensive reports, Julius AI democratizes data analysis, offering immediate insights and facilitating complex tasks through straightforward chat interactions, making it an invaluable resource for knowledge workers leveraging AI in data-driven endeavors.
Top Key Features
- Charts & Graphs: Effortlessly create sleek data visualizations to communicate findings.
- Insights: Ask any question to your data and receive answers instantly.
- Advanced Analysis: Perform predictive forecasting and modeling with ease.
- Problem Solving: Solve complex problems in mathematics, physics, and chemistry.
- Reports: Automatically generate polished analyses and summaries for various uses.
Pros & Cons:
- Time Efficiency: Significantly reduces manual data work from hours to minutes.
- Ease of Use: Allows natural language queries, making data analysis easy for all levels.
- Data Cleaning and Preparation: Automates prep tasks, enhancing focus on analysis.
- Instant Export: Enables quick downloads in formats like CSV or Excel.
- Innovative Visualization: Offers dynamic data animations for vivid insights.
- Limited Free Queries: Only 15 messages a month in the free version, potentially restrictive for frequent users.
2 Tableau AI
Tableau is a powerful visual analytics platform designed for comprehensive business intelligence.
Tableau AI integrates cutting-edge generative AI capabilities across the entire Tableau Platform, democratizing data analysis and simplifying insights consumption at scale.
This next-generation advancement speeds up the value delivery process and minimizes repetitive tasks for data analysts through intelligent suggestions and in-product guidance.
Thanks to its foundation on the Einstein Trust Layer, Tableau AI ensures trusted, ethical, and open AI-powered experiences without compromising data security and privacy.
It also enhances business user productivity by providing smart, personalized, and contextualized insights directly within their workflow.
Top Key Features
- Einstein Copilot for Tableau: Enhances data analyst productivity with contextually relevant help, improving visualization and dashboard quality through prescriptive guidance.
- Einstein Trust Layer: A foundation that addresses concerns about generative AI, ensuring enterprise-grade data security and compliance while harnessing the benefits of AI.
- Tableau Pulse: Utilizes AI to deliver automated analytics in plain language, proactively anticipating user questions and suggesting new queries, transforming engagement with data.
- Intuitive Data Exploration: Tableau’s user-friendly interface allows for easy navigation and data manipulation, making it simple for users to ask and answer complex questions.
- Robust Data Integration: It supports connections to a wide array of data sources, ensuring comprehensive analytics across different datasets.
- Advanced Analytics: With AI and ML integration, Tableau offers predictive insights and automated analytics, enhancing decision-making processes.
- Scalable Deployment: Tableau caters to businesses of all sizes with deployment options in the cloud, on-premises, or natively integrated with Salesforce CRM.
Pricing:
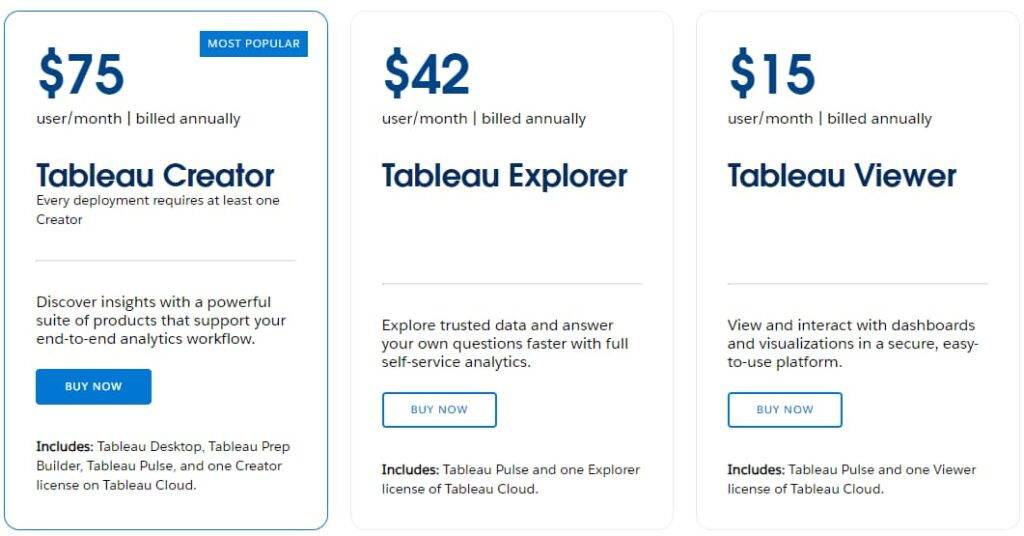
Tableau offers a tiered pricing model for teams and organizations, designed to accommodate the diverse needs of different user roles within a business.
- Tableau Creator: Priced at $75 per user per month
- Tableau Explorer: Available at $42 per user per month
- Tableau Viewer: At $15 per user per month
Pros & Cons:
- Accessibility: Brings advanced AI features within reach of all users, fostering inclusivity.
- Security and Privacy: Balances data protection and AI benefits through a robust trust layer.
- Efficiency: Streamlines analysis, preparation, and governance, accelerating insight generation.
- Complexity: Steep learning curve for non-technical users.
- Data Quality Dependence: Insight accuracy relies on data quality.
3 Polymer
Polymer presents a streamlined approach to Business Intelligence (BI), removing the complexity traditionally associated with BI tools.
It aims to make data visualization, dashboard creation, and data presentation accessible to users without requiring extensive technical knowledge or experience.
Polymer stands out by offering a platform where anyone can connect their data sources, whether through direct connectors like Shopify, Stripe, and Google Analytics, or by uploading datasets, and start gaining insights in minutes.
Polymer is crafted for simplicity and ease of use, It enables you to quickly create visualizations, build dashboards, and present data professionally.
With a focus on user-friendliness, Polymer empowers individuals across various roles and industries to harness the power of their data.
Top Key Features
- Easy Data Connection: Offers various data connectors and allows for easy dataset uploads, facilitating immediate data exploration and visualization.
- AI-Driven Insights: Polymer’s AI analyzes data to suggest insights and automatically builds beautiful dashboards, guiding users through the data storytelling process.
- Effortless Sharing: Enables users to easily share dashboards or specific charts, enhancing the presentation and distribution of data insights.
- E-Commerce Businesses: Owners and managers of e-commerce platforms can use Polymer to connect their store data (e.g., from Shopify) to uncover customer trends, purchase patterns, and actionable insights to drive sales and improve customer engagement.
- Marketing Teams: Marketing professionals can benefit from Polymer’s ability to integrate with advertising platforms (like Google Ads and Facebook Ads) to analyze campaign performance, identify top-performing demographics, and optimize ad spending for better conversions.
- Sales Departments: Sales teams can utilize Polymer to visualize sales data, track performance metrics, and identify opportunities for growth or areas needing improvement, enabling data-driven decision-making to boost sales effectiveness.
Pricing:
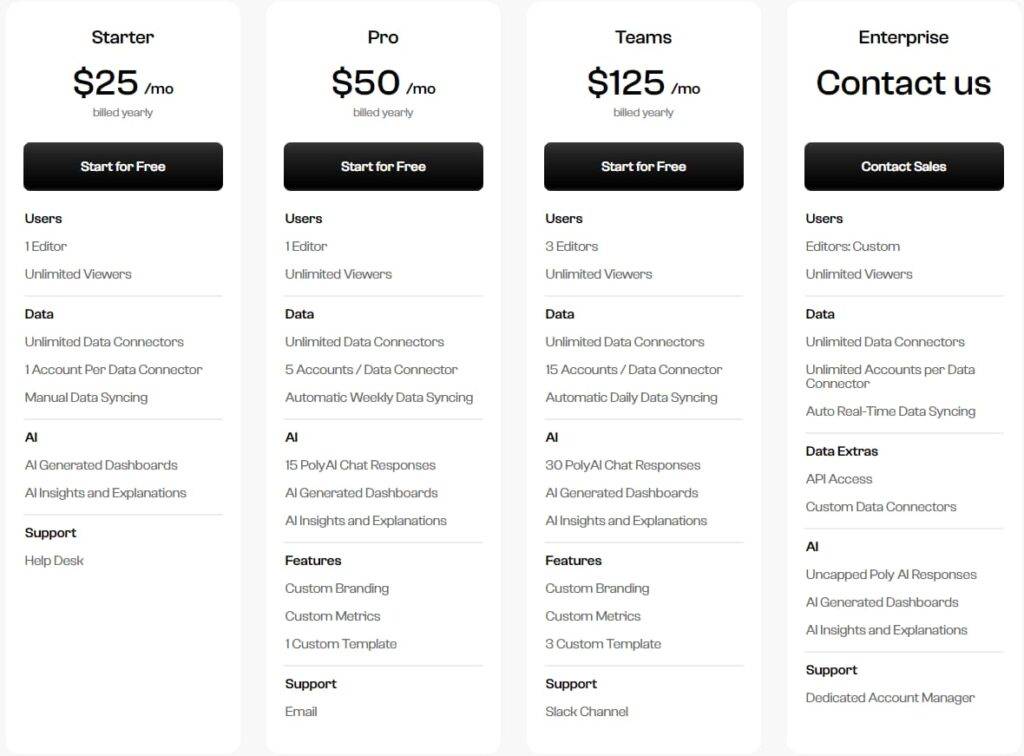
- Starter: $50/mo/ billed monthly and ($25/mo/billed yearly)
- Pro: $100/mo/ billed monthly and ($50/mo/billed yearly)
- Teams: $250/mo/ billed monthly and ($125/mo/billed yearly)
Pros & Cons:
- Accessibility: Easy data analysis and visualization for all user levels.
- AI Assistance: Speeds up insights with AI-driven suggestions and automation.
- Versatility in Sharing: Enables easy embedding and link sharing of visualizations.
- Data Integration Variety: Limited range of direct connectors for diverse data platforms.
4 MonkeyLearn
MonkeyLearn streamlines text analytics with a no-code platform that democratizes access to advanced artificial intelligence.
Designed for ease of use, it enables businesses to quickly clean, label, and visualize customer feedback, transforming unstructured text data into actionable insights.
With instant data visualizations, detailed insights, and both pre-built and custom machine learning models, MonkeyLearn caters to a diverse range of business needs, from analyzing customer sentiment to identifying trends.
Its intuitive interface allows even those without a technical background to leverage powerful text analysis tools, making data-driven decisions accessible to all, and supporting companies in becoming truly data-driven.
Top Key Features
- Comprehensive Text Analysis Workflow: Simplifies the analytics process by allowing users to easily connect and analyze text data from various sources, including emails, support tickets, and social media.
- Powerful Text Classifiers: Utilizes machine learning to accurately categorize text into topics, sentiments, intents, and urgencies, enabling quick analysis of customer feedback and other text data.
- Advanced Text Extractors: Identifies and extracts specific information like keywords, entities, and features from text, transforming unstructured data into structured insights with minimal manual effort.
- Seamless Integrations: Offers extensive connectivity with hundreds of applications through direct integrations, Zapier, or API, facilitating the automation of business workflows and the efficient analysis of text data across various platforms.
Pros & Cons:
- User-Friendly Interface: Enables complex analytics for non-technical users.
- Flexible Model Options: Provides both ready-made and customizable models.
- Integration Capabilities: Facilitates seamless connection with various apps and BI tools.
- Dependence on Pre-Defined Models: Convenience at the cost of full customization for specific need
5 Microsoft Power BI
Microsoft Power BI stands as an expert AI tool designed for business analytics, transforming raw data into insightful and actionable intelligence.
Tailored for businesses aiming to harness the power of data, Power BI enables you to make informed decisions swiftly and confidently.
As your gateway to data-driven decision-making, Power BI offers a comprehensive suite of tools to connect, visualize, and analyze your data.
Its integration with AI and machine learning not only simplifies data analysis but also unveils trends and patterns that might otherwise remain hidden.
With Power BI, you're empowered to create rich, interactive reports and dashboards, ensuring that critical business insights are always at your fingertips.
Top Key Features
- Advanced Data Visualization: Utilize a vast array of visualization tools to create customizable dashboards and reports that make your data come alive.
- AI-powered Analytics: Leverage built-in AI capabilities to perform advanced analytics, from automated insights to natural language queries.
- Seamless Integration: Effortlessly connect to hundreds of data sources, including cloud services, on-premise databases, and Excel files, ensuring a unified view of your business.
- Real-time Analytics: Make decisions based on the latest data with real-time analytics and streaming data capabilities.
- Secure Collaboration: Share insights and collaborate securely, both within and outside your organization, with granular access controls and governance features.
Pricing:
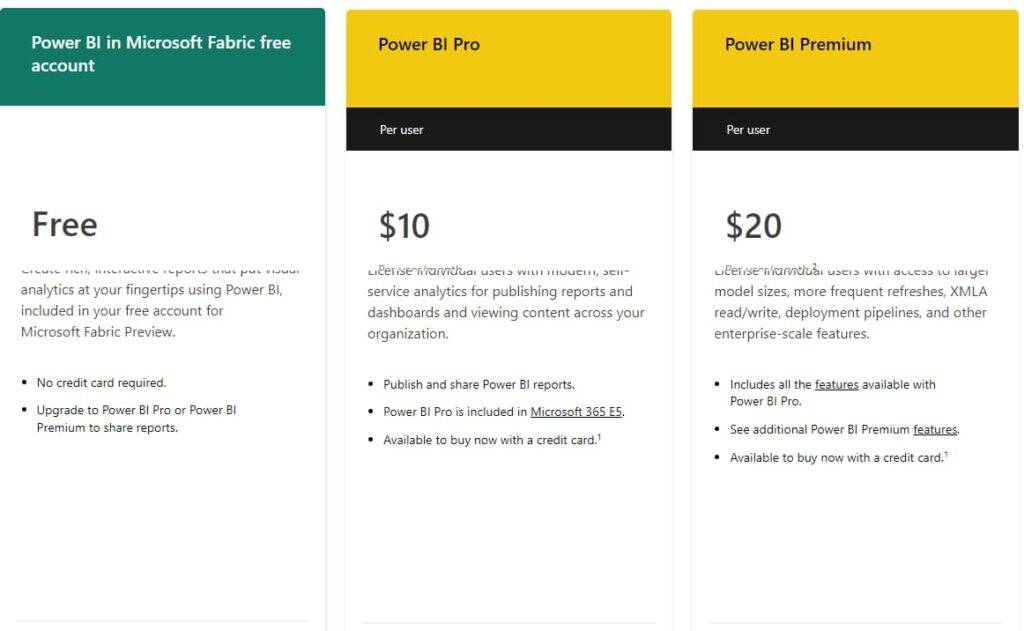
Power BI provides several pricing plans to suit different organizational needs:
- Power BI Free
- Power BI Pro: Available at $10.00 per user/month
- Power BI Premium Per User: Priced at $20.00 per user/month
Pros & Cons:
- User-Friendly Interface: Simplifies complex reporting for all users.
- Robust Microsoft Integration: Enhances productivity within the Microsoft ecosystem.
- Cost-Effective: Offers both a free version and competitively priced professional features.
- Comprehensive Security: Ensures data protection with extensive compliance standards.
- Performance with Large Datasets: Can slow down with very large datasets or complex visuals.
- Custom Visual Limitations: Offers many visuals but may lack the customization depth of specialized tools.
6 Akkio
Akkio is an innovative AI data platform tailored for agencies and their clients, revolutionizing AI analytics to enhance business outcomes.
It offers user-friendly, scalable, and cost-effective AI solutions for real-time decision-making.
Akkio empowers teams in account management, media, and data analysis to improve performance and achieve significant client success across various metrics like ROAS, CPC, and SEO optimization.
With a focus on increasing client revenue, enhancing SEO content results, and driving annual growth, Akkio serves as a pivotal tool for agencies seeking to leverage AI for analytics and decision-making, unlocking new opportunities for value creation and revenue generation.
Top Key Features
- AI-driven Analytics: Utilizes machine learning models and AI insights to predict future outcomes and generate key insights, enhancing campaign performance and client satisfaction.
- Comprehensive Data Integration: Offers the ability to integrate all data sources, preparing and optimizing data for analysis with tools that are accessible to users of all skill levels.
- Customizable AI Solutions: Provides white labeling and fully embedded AI solutions, allowing agencies to lead with AI and offer unique, branded analytics experiences.
- Interactive Insights with Chat: Employs chat-based exploration tools for strategic insights, enabling users to dig into data without coding and generate live, auto-refreshing reports and charts.
Pricing:
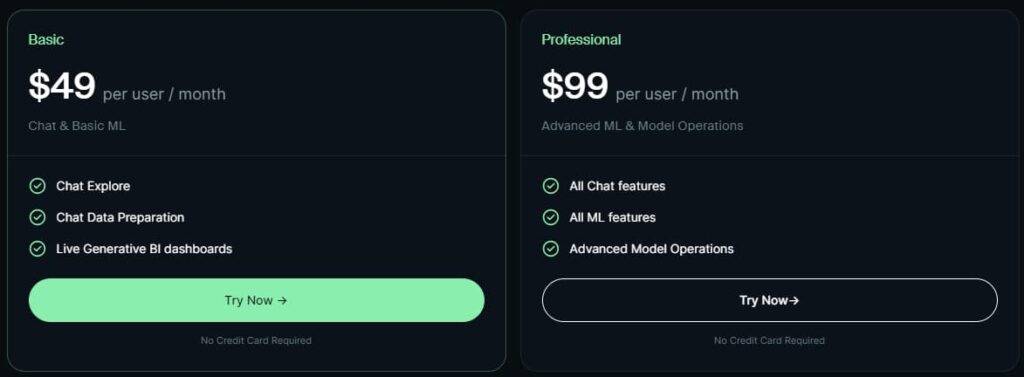
Akkio offers a straightforward pricing structure designed to make advanced AI accessible for businesses of all sizes:
- Basic Plan: $49 per user/month
- Professional Plan: $99 per user/month
- Organization Add-Ons Build-On Package: For $999 per organization/month
- Dedicated Server: For $1,999 per organization/month
Pros & Cons:
- Accessibility and Ease of Use: No-code AI analytics accessible to all users, simplifying data analysis.
- Scalability: Supports growth from small to large-scale projects.
- Customization: Extensive options including white labeling for brand alignment.
- Real-time Decision Making: Enables fast, data-driven decisions with real-time insights.
- Learning Curve: Familiarization with platform capabilities and AI best practices is needed, despite the no-code design.
7 Sisense
Sisense is a pioneering AI-driven business analytics platform designed to transform your data into actionable insights and substantial revenue.
Tailored for embedding intelligent analytics directly into your products, Sisense empowers you to leverage AI and machine learning across various industries and applications.
Its flexible approach caters to a wide array of development preferences, from pro-code to low-code and no-code options, ensuring that you can harness the full power of data analytics regardless of your technical expertise.
Sisense enables you to not just understand your data but to also predict trends, optimize processes, and enhance decision-making.
Its innovative platform offers a comprehensive suite for creating, managing, and deploying analytics at scale, making it easier for you to infuse analytics into every aspect of your business and product offerings.
Top Key Features
- AI-Powered Analytics: Harness the power of AI to uncover deep insights, predict outcomes, and automate data analysis tasks.
- Flexible Development: Cater to developers of all skill levels with pro-code, low-code, and no-code capabilities for building and customizing analytics solutions.
- Embeddable Analytics: Seamlessly integrate Sisense analytics into your applications, providing users with intuitive and interactive data experiences.
- Cloud-Native Architecture: Enjoy the flexibility of a platform that’s cloud-native, supporting any cloud infrastructure and facilitating easy scalability and maintenance.
- Comprehensive Integration: Connect to various data sources (Excel or Google Sheets), applications, and services, ensuring a unified view of your data landscape.
Pricing:
Sisense adopts a ‘no-surprise’ pricing approach, focusing on working closely with you to tailor a solution that meets your specific needs while fitting within your budget
Pros & Cons:
- User Accessibility: Enables users of all skill levels to easily create and use analytics.
- Customization & Integration: Offers tailored solutions that fit into existing workflows seamlessly.
- Innovative AI Features: Provides advanced insights and automates analysis for better decision-making.
- Scalability: Supports business growth with a scalable, cloud-native architecture.
- Learning Curve: While designed to be accessible, the depth and breadth of Sisense’s capabilities may present a learning curve for new users, particularly for advanced customizations and integrations.
8 Google Looker
Looker Studio, formerly known as Google Data Studio, transforms the way you visualize and report data.
This powerful, free tool from Google allows you to unlock the full potential of your data through interactive dashboards and aesthetically pleasing reports that drive smarter business decisions.
Looker Studio is designed to be accessible and user-friendly, making it easier for anyone to create detailed reports and data visualizations without extensive technical expertise.
Looker Studio empowers you to connect to a wide array of data sources, offering both built-in and partner connectors.
This flexibility ensures that you can easily access virtually any kind of data.
Once connected, Looker Studio enables you to transform your data into engaging stories of data visualization art.
With its web-based reporting tools, you can quickly build interactive reports and dashboards, facilitating a deeper understanding of your data.
Top Key Features
- Data Connectivity: Provides extensive connectivity options, allowing you to seamlessly integrate data from various sources, including Google Sheets, Google Ads, Analytics, and many third-party sources.
- Interactive Reporting: Enables the creation of dynamic, interactive reports and dashboards that make data exploration intuitive and informative.
- Collaboration and Sharing: Offers robust sharing and collaboration features. You can easily share reports and dashboards with individuals, teams, or even publicly, and collaborate in real-time.
- Customization and Embedding: Allow for high levels of customization and the ability to embed reports on web pages, ensuring that insights are accessible where they’re needed most.
- Developer Extensibility: Looker Studio can be extended through its developer platform for those with development resources, offering even greater flexibility and customization.
Pros & Cons:
- Cost-Effective: Free, making advanced data visualization and reporting accessible to all businesses.
- User-Friendly: Intuitive, with a drag-and-drop interface for ease of use by non-technical users.
- Google Ecosystem Integration: Enhances productivity by seamlessly integrating with Google's tools.
- Real-Time Data: Offers real-time data reporting for timely decision-making.
- Limited Advanced Analytics Features: While excellent for visualization and basic to intermediate analytics, Looker Studio might lack some advanced analytical functions available in more specialized or premium tools.
9 Qlik Sense
Qlik Sense is a leading analytics platform that elevates data analysis with its associative analytics engine and AI capabilities, enabling interactive and insightful exploration beyond traditional dashboards.
Designed for users at every skill level, it supports a broad range of use cases including self-service visualization, guided analytics, and advanced applications.
With a focus on rapid, data-driven decision-making, Qlik Sense is trusted by over 40,000 customers globally to enhance data literacy and foster a data-centric culture.
Its versatility in handling everything from simple visualizations to complex predictive analytics positions Qlik Sense as a top choice for organizations seeking to unlock the full potential of their data.
Top Key Features
- Associative Analytics Engine: Unleashes the power to explore data freely, without the limitations of query-based tools, uncovering hidden insights.
- Augmented Intelligence and ML: Integrates AI and machine learning deeply into the platform to automate data analysis and insight generation, making advanced analytics accessible to everyone.
- Interactive Dashboards and Visualizations: Offers best-in-class visualization and dashboard capabilities that are highly interactive and customizable.
- Comprehensive Data Integration: Seamlessly connects to numerous data sources, ensuring that users can access and analyze all their data in one place.
- Real-Time Data Pipeline: Combines real-time data access with action-oriented analytics and alerting, enabling organizations to respond to business moments as they happen.
Pros & Cons:
- User-Friendly: Intuitive and flexible for all skill levels, promoting exploration and creativity.
- Powerful Data Processing: Uses an associative model for complex analysis without needing data pre-aggregation.
- Scalability: Adaptable for any business size, with cloud, on-premise, and hybrid options.
- Collaboration and Mobility: Facilitates teamwork and supports mobile access for decision-making on the go.
- Learning Curve: An initial learning period is needed due to its unique model and features.
- Integration Complexity: Setting up data connections can be complex and time-consuming.
10 Splunk
Splunk stands as a leading AI analytics tool, revolutionizing business analytics by unlocking complex IT systems and offering data-driven insights for superior operational efficiency.
Designed for organizations pursuing digital transformation, Splunk leverages AI and machine learning to transform data into actionable intelligence, fostering enterprise resilience.
It enables proactive issue resolution, aids in swift recovery from disruptions, and ensures a competitive edge through improved operational insights.
As an AI analytics powerhouse, Splunk provides real-time data processing and deep insights, making it crucial for businesses aiming for operational excellence and digital resilience, ensuring they remain agile and informed in a rapidly evolving digital landscape.
Top Key Features
- AI and Machine Learning: Incorporates AI and ML to automate the analysis, enhancing threat detection, system monitoring, and predictive insights.
- Real-time Data Processing: Offers the capability to process and analyze data in real-time, ensuring immediate visibility into operations and threats.
- Comprehensive Data Integration: Seamlessly integrates with a myriad of data sources, providing a holistic view of the enterprise data landscape.
- Advanced Analytics and Visualization: Delivers sophisticated analytics and dynamic visualizations to simplify complex data, making insights accessible to all user levels.
- Operational Intelligence: Enables operational intelligence by offering detailed insights into machine-generated data, facilitating improved decision-making.
Pros & Cons:
- Scalability: Handles large data volumes easily, maintaining performance as your business grows.
- Versatility: Offers solutions for various industries, including security and IT operations.
- User Empowerment: Makes data analysis accessible to all expertise levels, promoting a data-informed culture.
- Rapid Problem Resolution: Enables fast issue identification and resolution, ensuring operational continuity
- Complexity for Beginners: Its extensive functionalities and advanced options may overwhelm new or less technical users.
Conclusion
The landscape of business analytics has been significantly enriched by the advent of AI tools, marking a pivotal shift in how organizations approach data-driven decision-making.
As we have seen, the best AI tools for business analytics, such as Splunk, Qlik Sense, and Julius AI, offer robust capabilities ranging from data integration and visualization to predictive modeling and interactive insights.
These tools not only streamline analytical processes but also enable businesses to anticipate future challenges and opportunities, ensuring they remain agile and informed.
In harnessing the power of AI for business analytics, organizations are better positioned to navigate the complexities of the modern marketplace, driving innovation and securing a competitive edge.
Also Read:
- Best AI Website Builders: (Paid and Free)
- Best AI SEO Tools: Boost Your Rankings
- Best AI Logo Generators You Should Try in 2024
- Best Text To Speech Generator Online
- Best AI Presentation Generator: Elevate Your Slides
- Best AI Art Generators: From Text to Masterpiece
- Best AI Audio Enhancers: Elevate Your Sound


Discussion about this post