

Ever felt overwhelmed by complex ideas or processes? The “Show Me ChatGPT Plugin” is here to help. This tool quickly turns your thoughts into clear, easy-to-understand diagrams. Whether you’re a student, project manager, or writer, the Show Me ChatGPT Plugin is your secret weapon for visualizing ideas. Let’s dive into how this game-changing tool can revolutionize your learning and communication.
What is the Show Me Plugin?
The “Show Me ChatGPT Plugin” is a powerful tool designed to bring your ideas to life. It’s a plugin that integrates seamlessly with ChatGPT, a state-of-the-art language model developed by OpenAI. But what sets the Show Me Plugin apart is its unique ability to create visual diagrams based on your input.
Imagine having a personal illustrator at your fingertips, ready to draw out your thoughts, ideas, and concepts in real-time. That’s what the Show Me Plugin offers. It’s not just about text anymore; it’s about visualizing your ideas, making them more understandable and engaging.
How Does the Show Me Plugin Work?
Now, you might be wondering, how does this magic happen? The secret lies in the plugin’s workflow and its use of Mermaid syntax.
When you ask for a diagram or a visualization of a concept, the Show Me Plugin gets to work. It takes your request and translates it into a diagram using Mermaid syntax. Mermaid is a simple yet powerful language specifically designed for generating diagrams.

Once the plugin has created the diagram in Mermaid syntax, it sends this information to be rendered into a visual diagram.
The result? A clear, easy-to-understand diagram that brings your idea to life.
The Show Me Plugin and Mermaid syntax are a match made in heaven. Together, they make creating diagrams a breeze, helping you visualize complex ideas in seconds. So, whether you’re explaining a process, brainstorming a project, or just trying to understand a complex concept, the Show Me ChatGPT Plugin has got you covered
Getting Started with the Show Me Plugin
Installation and Setup
Step 1: Access the ChatGPT Interface Settings
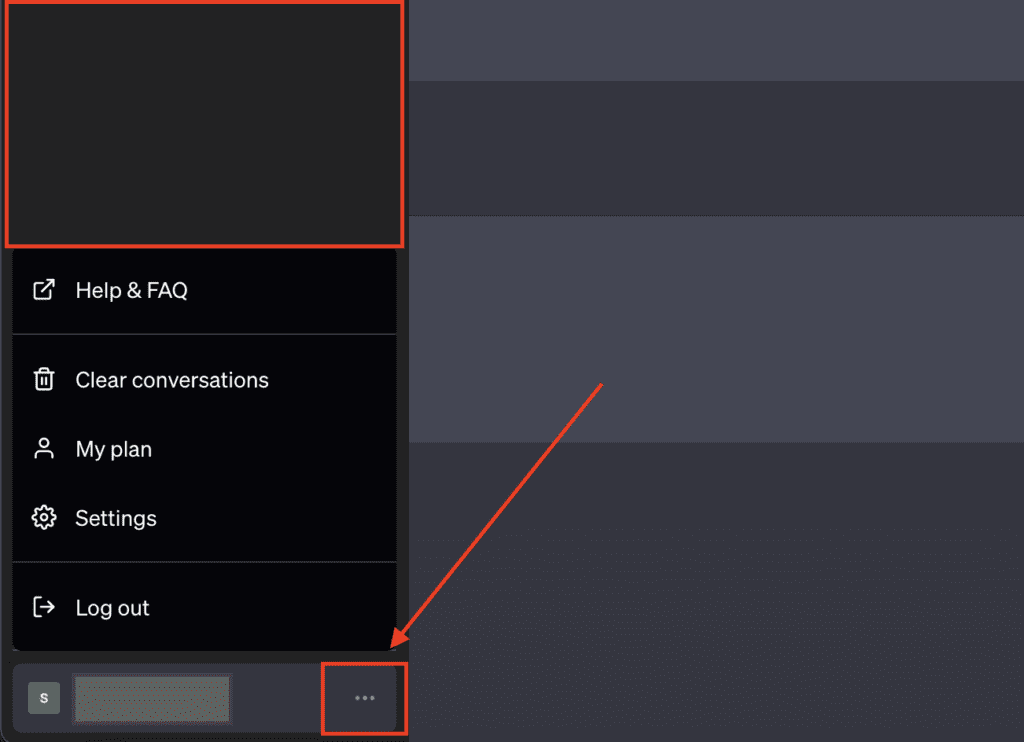
First things first, you’ll need to open up your ChatGPT interface. Once you’re there, look for the settings option, Click on the three dots and then select “Settings” from the dropdown menu.
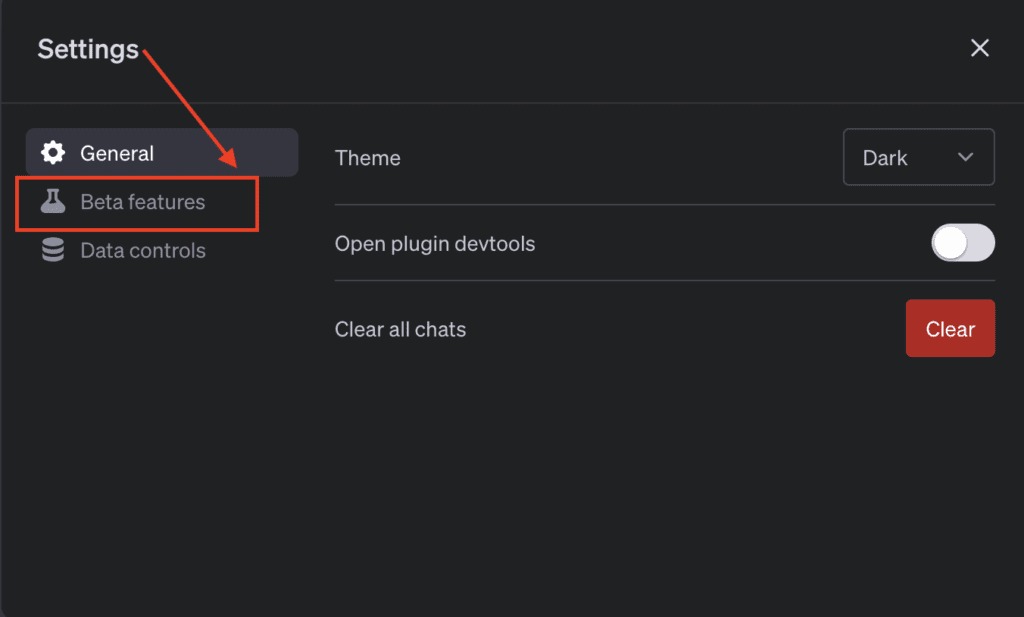
Step 2: Navigate to the Beta Features
In the settings, you’ll find an option that says “Beta Features”. This is where OpenAI introduces new and experimental features for users to try out. Click on “Beta Features” to proceed.
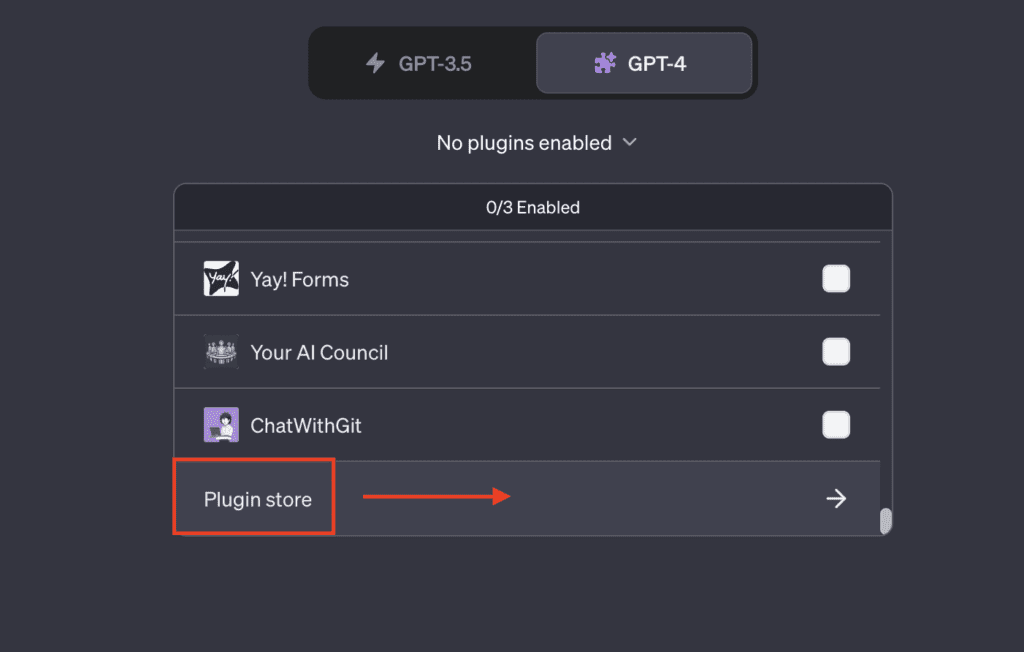
Step 3: Select the Plugins Option
Under “Beta Features”, you’ll find an option for “Plugins”. This is where you can manage the plugins for your ChatGPT. Click on “Plugins” to open up the plugin options.
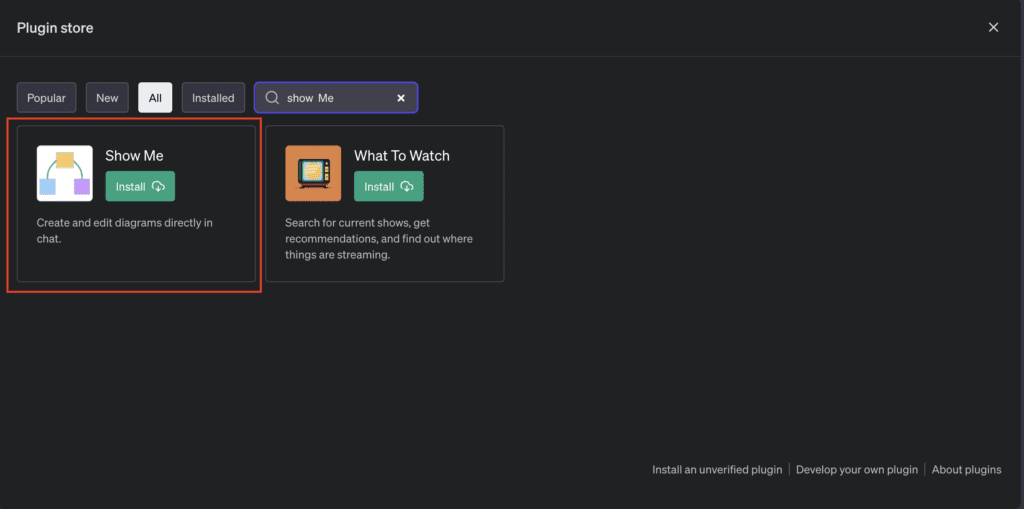
Step 5: Install the Show me Plugin
In the Plugin Store, look for the Show me Plugin. Once you’ve found it, there should be an “Install” button next to it. Click on “Install” to add the Show me Plugin to your ChatGPT.
Understanding Mermaid Syntax
Now that you’ve got the Show Me Plugin set up, let’s dive into the heart of creating diagrams: Mermaid syntax.
Mermaid syntax is a language designed for generating diagrams. It’s simple to learn, yet powerful enough to create complex visuals. Here are the basics:
- Nodes: Nodes are the main elements in your diagram. They represent the key points or steps in your process. In Mermaid syntax, you define a node with an identifier and a label. For example,
A["Start"]creates a node labeled “Start”. - Edges: Edges are the lines that connect your nodes. They represent the relationships or transitions between your points or steps. In Mermaid syntax, you define an edge with two node identifiers and an arrow. For example,
A --> Bcreates an edge from node A to node B.
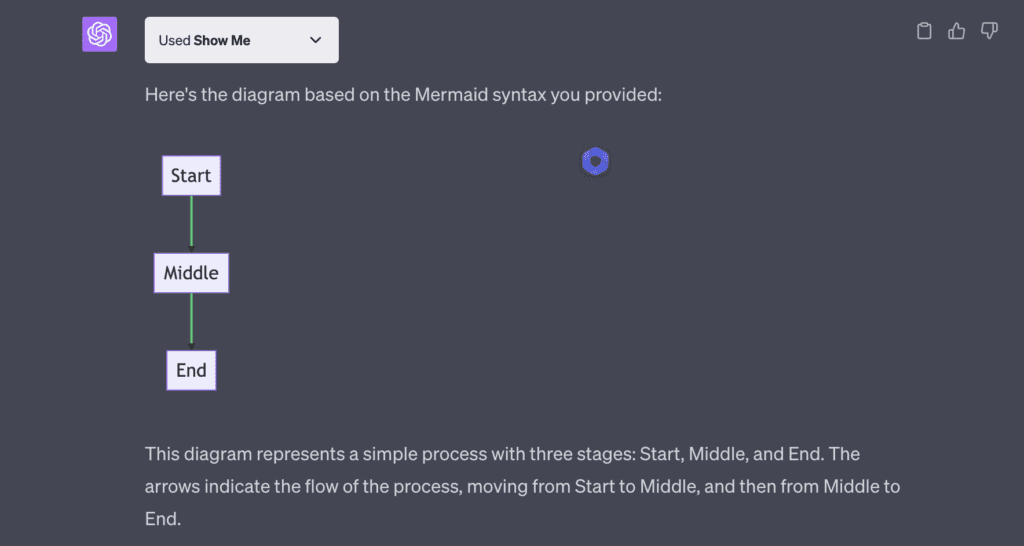
Here’s an example of a simple diagram using Mermaid syntax:
graph TB

A["Start"]

B["Middle"]

C["End"]

A --> B

B --> C
This creates a diagram with three nodes (Start, Middle, and End) and two edges (from Start to Middle, and from Middle to End).
With these basics, you’re ready to start creating your own diagrams with the Show Me ChatGPT Plugin. Remember, practice makes perfect.
Advanced Features of the Show Me Plugin
Using Different Diagram Languages
While Mermaid is the default language used by the Show Me Plugin, it’s not the only one. The plugin supports a variety of diagram languages, each with its own unique features and capabilities. This flexibility allows you to choose the language that best suits your needs and preferences.
List of Supported Diagram Languages
- Mermaid: This is the default language for the Show Me Plugin. It’s a simple yet powerful language that’s great for creating a wide range of diagrams, from flowcharts to sequence diagrams and more.
- Graphviz: This is another popular diagram language. It’s particularly good for creating graphs, where the relationships between nodes are key.
- PlantUML: This language is designed for creating UML (Unified Modeling Language) diagrams. It’s a great choice if you’re working on software design and need to create class diagrams, use case diagrams, and the like.
- And others: The Show Me Plugin supports several other diagram languages as well. Each has its own strengths, so you can choose the one that best fits your needs.
To specify the diagram language in the plugin parameters, you use the diagramLanguage parameter. For example, if you wanted to use Graphviz instead of Mermaid, you would include "diagramLanguage": "graphviz" in your plugin request.
Remember, the Show Me Plugin is all about flexibility and power. By supporting multiple diagram languages, it gives you the freedom to create the diagrams that best represent your ideas. So don’t be afraid to experiment with different languages and see what they can do!
Creating Complex Diagrams
Creating complex diagrams involves a series of steps that require the integration of multiple tools and data sources. In this case, we used the Wolfram Alpha Plugin and Show Me plugins to create a graph of the five biggest airports in the US, with edges between every pair, each labeled with the flight distance between those two airports.
Here’s a step-by-step breakdown of the process:
-
Identify the Data Needed: The first step is to identify the data needed for the diagram. In this case, we needed the names of the five biggest airports in the US and the flight distances between each pair.
{
  "input": "five biggest airports in the US"
}
Query:
"five biggest airports in the US"

Assumption:
Assuming "biggest" refers to annual passengers
To use as number of runways set assumption=*DPClash.AirportP.biggest-_*NumberRunways-
To use as longest runway length set assumption=*DPClash.AirportP.biggest-_*LongestRunwayLength-

Input interpretation:
5 biggest airports | by annual passengers
in United States

Result:
1 | Hartsfield-Jackson Atlanta International Airport | 107 million people/yr
2 | Los Angeles International Airport | 87.5 million people/yr
3 | Chicago O'Hare International Airport | 83.2 million people/yr
4 | Dallas-Fort Worth International Airport | 69.1 million people/yr
5 | Denver International Airport | 64.5 million people/yr

Path:
image: https://www6b3.wolframalpha.com/Calculate/MSP/MSP12319fd7f57e1i7i5b6000061c475d0f6adb7gi?MSPStoreType=image/png&s=18

Distances:
 | distance | flight time
Hartsfield-Jackson Atlanta International Airport to Los Angeles International Airport | 1946 miles | 3 hours 30 minutes
Los Angeles International Airport to Chicago O'Hare International Airport | 1745 miles | 3 hours 10 minutes
Chicago O'Hare International Airport to Dallas-Fort Worth International Airport | 802 miles | 1 hour 25 minutes
Dallas-Fort Worth International Airport to Denver International Airport | 641 miles | 1 hour 10 minutes
total | 5134 miles | 9 hours 20 minutes
(assuming direct flight path at 550 mph)

Runway data:
elevation | median | 668 ft
 | highest | 5431 ft (Denver International Airport)
 | lowest | 126 ft (Los Angeles International Airport)
number of runways | median | 6
 | highest | 7 (Chicago O'Hare International Airport and Dallas-Fort Worth International Airport)
 | lowest | 4 (Los Angeles International Airport)
 | distribution |
longest runway length | median | 13001 ft
 | highest | 16000 ft (Denver International Airport)
 | lowest | 11890 ft (Hartsfield-Jackson Atlanta International Airport)
 | distribution |
image: https://www6b3.wolframalpha.com/Calculate/MSP/MSP12419fd7f57e1i7i5b600004fg03f7i9ggi74a5?MSPStoreType=image/png&s=18

Wikipedia page hits history:
image: https://www6b3.wolframalpha.com/Calculate/MSP/MSP12519fd7f57e1i7i5b600006ag1ebb457gf464f?MSPStoreType=image/png&s=18

Wolfram|Alpha website result for "five biggest airports in the US":
https://www.wolframalpha.com/input?i=five+biggest+airports+in+the+US-
Retrieve the Data: We used the Wolfram Alpha plugin to retrieve the required data. We made a series of queries to Wolfram Alpha to get the names of the five biggest airports and the flight distances between each pair. Wolfram Alpha is a powerful computational engine that can provide a wide range of data in response to natural language queries.

-
Structure the Data: Once we had the data, we structured it in a format suitable for creating a diagram. In this case, we created a graph structure where the airports are nodes and the flight distances are edges between the nodes.
-
Create the Diagram: We used the Show Me plugin to create the diagram. We provided the graph structure to the plugin in Mermaid syntax, a simple markup language for generating diagrams. The plugin then generated a visual diagram based on this structure.
-
Present the Diagram: Finally, we presented the diagram to the user, along with a link to edit the diagram online if they wish to make any changes.

This process demonstrates how multiple plugins can be used together to create complex diagrams. The key is to understand the capabilities of each plugin and how they can be combined to achieve the desired result.
Read More : AnyBarChart ChatGPT Plugin: Visualize Data Easily
Is Show Me Secure?
In the digital age, security and privacy are paramount. Users of any online tool need to be assured that their data is safe and their privacy respected. The Show Me Plugin is no exception. Let’s explore how this plugin handles these critical aspects.
Privacy Policy
The Show Me Plugin has a strong commitment to privacy. Here’s a breakdown of its privacy policy:
- Data Collection: The plugin collects only the data necessary for its operation. This includes the diagram data that users generate within the plugin. Importantly, it does not collect any personal identification information.
- Data Usage: The data collected is used exclusively for improving the plugin’s services. Specifically, it is used for diagnosing and fixing rendering issues. This means that the diagrams generated with the plugin are analyzed only when there are issues with rendering, with the goal of delivering a better user experience.
- Data Sharing: The Show Me Plugin respects users’ privacy and values their trust. As such, it does not share, sell, or trade user data with any third parties.
- Changes to the Privacy Policy: The Privacy Policy of the Show Me Plugin may change from time to time. However, users’ rights under this Privacy Policy will not be reduced without their explicit consent. Any changes will be posted on the plugin’s page.
If users have any questions or concerns about the privacy policy of the Show Me Plugin, they are encouraged to reach out to the plugin’s support team. The team is dedicated to ensuring that users’ experiences with the Show Me Plugin are not only productive but also secure.
Troubleshooting Common Issues
Like any tool, the Show Me Plugin may occasionally present challenges. However, most issues can be resolved with a bit of troubleshooting. Here are some common issues you might encounter and their solutions:
Common Issues and Solutions
High Load of Requests for Rendering Diagrams:
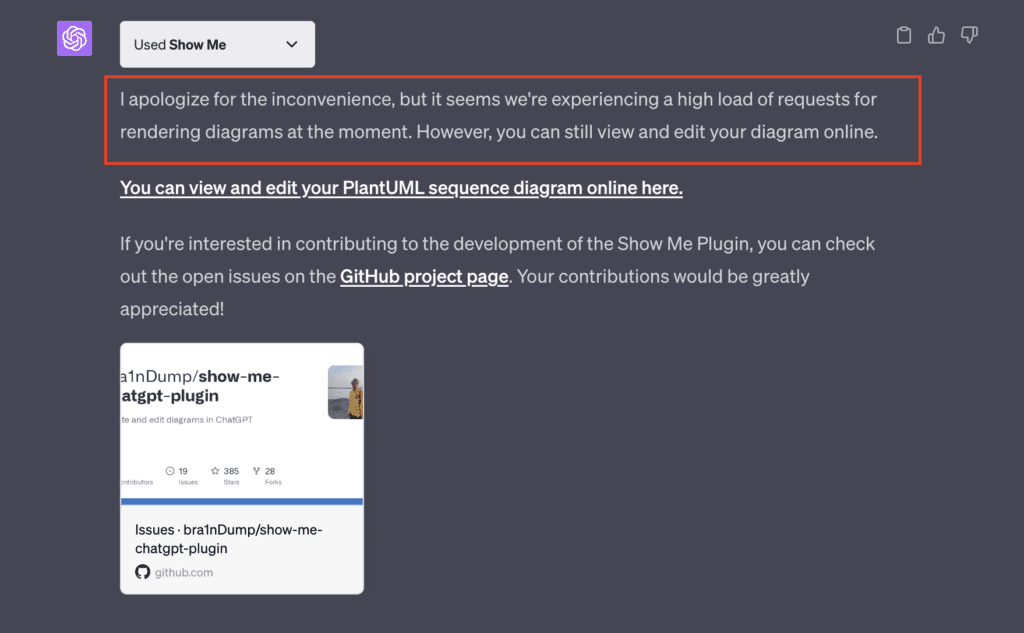
Description: Sometimes, due to a high number of users requesting diagrams simultaneously, you might experience a delay in the rendering of your diagram.
Solution: If you encounter this issue, don’t worry. You will still receive a link to view and edit your diagram online. You can use this link to access your diagram while the load reduces. If the issue persists, consider trying again at a different time.
Issue 2: Diagram Not Rendering Correctly
Description: There might be instances where your diagram doesn’t render as expected. This could be due to a syntax error in your diagram language.
Solution: Check your syntax carefully. Make sure you’re using the correct diagram language and that your syntax follows the rules of that language. If you’re using Mermaid, for example, ensure that your nodes and edges are defined correctly.
Issue 3: Plugin Not Responding
Description: In rare cases, the Show Me Plugin might not respond to your requests.
Solution: If this happens, first check your internet connection to make sure it’s stable. If the problem persists, try disabling and re-enabling the plugin. If the issue still isn’t resolved, consider reaching out to the support team for further assistance.
Remember, the Show Me Plugin is a powerful tool designed to make your life easier. If you encounter any issues, don’t hesitate to seek help. With a bit of troubleshooting, you’ll be back to creating diagrams in no time!
Appendix: Mermaid Syntax Cheat Sheet
Mermaid syntax is a powerful tool for creating diagrams, but it can be a bit tricky to remember all the different elements. Here’s a handy cheat sheet for the most commonly used elements in Mermaid syntax, along with examples of how to use them to create different types of diagrams.
Nodes
Nodes are the primary elements in a diagram. They represent entities or steps in a process.
Simple node: A[Node A]

Round node: B((Node B))

Asymmetric node: C>Node C]

Rhombus node: D{Node D}
Edges
Edges represent relationships or transitions between nodes.
Arrow: A --> B

Dotted arrow: A -.-> B

Thick arrow: A ==> B

Arrow with label: A -- Edge label --> B
Subgraphs
Subgraphs group related nodes together.
subgraph Subgraph Name
A[Node A]
B[Node B]
end
Flowchart Example
Here’s an example of a simple flowchart using Mermaid syntax:
graph TB
A[Start] --> B{Is it raining?}
B -->|Yes| C[Take umbrella]
B -->|No| D[Go outside]
Sequence Diagram Example
Here’s an example of a sequence diagram using Mermaid syntax:
sequenceDiagram
User->>+System: Login
System->>+Database: Validate Credentials
Database-->>-System: Validation Result
System-->>-User: Login Result
Remember, this is just a basic guide. Mermaid syntax is capable of creating much more complex diagrams, so don’t be afraid to experiment and learn more!
Contributing to the Show Me Plugin
The Show Me Plugin is an open-source project, and contributions from the community are highly encouraged. Whether you’re a developer, a designer, or just someone who uses the plugin, your input can help make the Show Me Plugin even better.
Here’s how you can contribute:
- Report Issues: If you encounter a bug or have a feature request, you can report it on the GitHub repository. This helps the developers understand what needs to be fixed or improved.
- Contribute Code: If you’re a developer, you can contribute directly to the codebase. Whether it’s fixing a bug, adding a new feature, or improving the documentation, your contributions are welcome.
- Test New Features: Before new features are released, they need to be tested. You can help by trying out these features and providing feedback.
- Spread the Word: If you find the Show Me Plugin useful, tell others about it. The more people use the plugin, the more feedback and contributions the project will receive, leading to a better tool for everyone.
If you’re interested in contributing, you can visit the Show Me Plugin GitHub repository. There, you’ll find more information on how to get started, as well as a list of open issues that you can help with.
Conclusion
In this comprehensive guide, we’ve explored the Show Me Plugin, a powerful tool that integrates with ChatGPT to create and edit diagrams in seconds.
The Show Me Plugin is a testament to the power of visual representation in enhancing understanding and communication. Whether you’re explaining a complex process, visualizing a system’s architecture, or just brainstorming ideas, diagrams can make your task easier and more effective.
Now that you’re equipped with the knowledge of how the Show Me Plugin works, it’s time to put it into practice. Start creating your own diagrams, experiment with different diagram languages, and don’t hesitate to contribute to the plugin’s development.


Discussion about this post